HOW TO MEASURE TRADE SHOW EFFECTIVENESS: TOP 10 KPIs
Measuring trade show effectiveness helps brands see their return on investment (ROI) and return on opportunity (ROO). This way, they can make smart choices for future events based on data.
With dozens of possible metrics to track, focus on the most impactful key performance indicators (KPIs) for your company. Not all organizations have the same objectives. In this guide, we’ll explore the top 10 KPIs for both B2B and B2C trade shows and strategies to accurately gauge the success of your trade show marketing efforts.
Whether you’re focused on business-to-business or business-to-consumer events, understanding these core metrics will help you make the business case for your marketing spend with data as your input.
“Measuring trade show effectiveness starts with intentional planning and focusing on what truly matters,” said Don Gonse, Chief Sales Officer at NPARALLEL + Atomic Props. “Our team partners closely with clients to deeply understand their business objectives, ensuring that every program we deliver is aligned with their goals and drives meaningful results.”
Understanding B2B vs B2C Trade Show Metrics

While some trade show KPIs overlap, B2B and B2C businesses often focus on different metrics because of different sales cycles and customer relationships. Understanding these differences is crucial for setting appropriate goals and measuring success effectively.
B2B: Top 10 Trade Show KPIs
1. Qualified leads generated (emphasis on quality over quantity)
2. Lead-to-opportunity conversion rate by score range
3. Average deal size of opportunities created
4. Number of scheduled follow-up meetings or demos
5. Contract value of deals closed post-show
6. Decision-maker engagement rate
7. Sales cycle duration for trade show leads
8. Cost per qualified lead
9. ROI by lead score category
10. Pipeline velocity and conversion rates at each stage

B2B metrics usually focus more on long-term relationship building and pipeline development, reflecting B2B sales cycles and higher transaction values.
B2C: Top 10 Trade Show KPIs
1. Total foot traffic
2. Direct sales revenue at the event
3. Number of product demonstrations given
4. Email/loyalty program sign-ups
5. Units sold during and immediately after show
6. Cost per acquisition
7. Average transaction value
8. Customer satisfaction scores
9. Social media engagement during the event
10. Post-show customer retention rates
B2C metrics often emphasize immediate sales and brand exposure, reflecting the typically shorter sales cycle and lower transaction values.
Common KPIs for Both:
• Return on investment (ROI)
• Cost per visitor
• Booth traffic and engagement metrics
• Lead conversion rates
• Customer feedback and satisfaction scores
• Media coverage and PR value
• Social media metrics (follower growth,
engagement rate, reach)
• Website traffic lift during and after the show
• Increase in brand search volume
• Post-show survey results

Essential Types of Measurement
1. Booth Traffic and Engagement
Track visitor quantity and quality through multiple methods to ensure accurate data collection:
Quantitative Measurements:
- Badge scanning
- Beacon or RFID technology for precise tracking
- Time-lapse video or periodic photos
- Entry/exit point monitoring
- Peak traffic times and patterns
Qualitative Measurements:
- Average time spent at booth
- Number of product demos given
- Quantity of marketing materials distributed
- Interaction quality scores
- Staff-to-visitor ratios
- Engagement with interactive displays
- Questions asked and interest shown
2. Trade Show Lead Capture and Qualification
Implement a structured lead qualification process that ensures consistent evaluation and follow-up. Capture leads at trade shows using mobile lead scanning apps or digital forms. Collect the following information and qualify based on these data points:
1. Contact Information:
- Basic contact details
- Company information
- Role and decision-making authority
- Specific interests and needs
- Preferred follow-up method
2. On-Site Qualification:
- Current challenges and pain points
- Budget availability
- Decision timeline
- Competitive situation
- Next steps and follow-up preferences
3. Follow-Up Process:
- 24-48 hour initial contact
- Personalized communication plan
- Content sharing based on interests
- Meeting scheduling
- Regular touch points

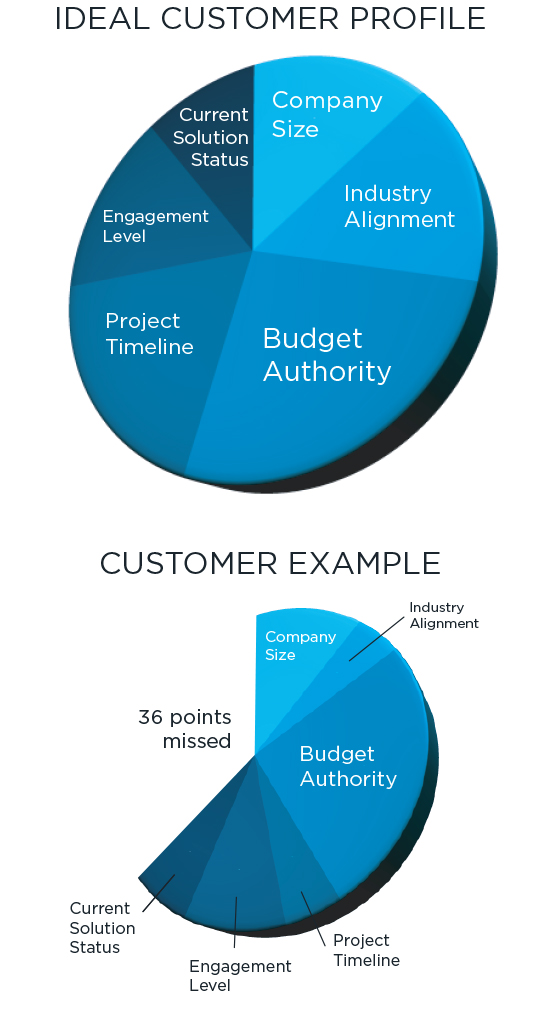
3. Lead Scoring System (B2B Focus)
Create a comprehensive scoring system (100 points total) that accurately reflects your ideal customer profile. An example is outlined below.
Company Fit (30 points):
Company Size
* Enterprise (500+ employees): 15 points
* Mid-market (100-499 employees): 12 points
* Small business (1-99 employees): 8 points
Industry Alignment
* Perfect match with target industries: 15 points
* Related industry: 10 points
* Non-target industry: 5 points
Budget Authority (25 points):
- Decision Maker (C-level, VP, Director): 25 points
- Influencer (Manager, Team Lead): 15 points
- User/Individual Contributor: 5 points
Project Timeline (20 points):
- Immediate need (0-3 months): 20 points
- Near-term (3-6 months): 15 points
- Long-term (6+ months): 10 points
- No specific timeline: 5 points
Engagement Level (15 points):
- Requested demo/follow-up meeting: 15 points
- Participated in booth presentation: 10 points
- Shared contact information: 5 points
- Collected marketing materials: 3 points
Current Solution Status (10 points):
- Currently evaluating solutions: 10 points
- Has competing solution but open to change: 7 points
- Satisfied with current solution: 3 points
4. Trade Show Cost Analysis and ROI Calculation
Accurate cost analysis and ROI calculation are essential for making the business case for trade show participation and optimizing future investments.
Calculate Cost Per Lead (CPL):
CPL = (Booth cost + staff travel/expenses + show services + promotions) / Number of leads
Include all relevant costs:
- Booth expenses (design, build, transportation, etc.)
- Marketing materials and promotions
- Travel and accommodation
- Staffing expenses
- Technology and miscellaneous costs
- Pre-show marketing efforts
- Post-show follow-up resources
Calculate ROI:
Trade Show ROI = (Total revenue / Total cost) × 100
For accurate trade show ROI calculation, track both immediate and long-term revenue:
- Direct sales at the event
- Sales closed within 30 days
- Pipeline value from generated leads
- Expected revenue based on historical conversion rates
Post-Show Analysis and Continuous Improvement
After each show, conduct a comprehensive analysis to drive future success:
1. Performance Review:
- Compare results against initial goals
- Analyze metrics across all KPIs
- Review lead quality and conversion rates
- Assess team performance and feedback
2. Lead Pipeline Tracking:
- Monitor lead progression through sales stages
- Track conversion rates at each stage
- Measure average sales cycle length
- Calculate revenue generated per lead source
3. Documentation and Learning:
- Record successful strategies
- Identify areas for improvement
- Document lessons learned
- Collect team feedback and suggestions
4. Strategy Refinement:
- Adjust lead scoring criteria if needed
- Optimize booth layout and staffing
- Refine follow-up processes
- Update marketing materials and messaging
- Plan improvements for future shows
By implementing these comprehensive measurement strategies, you’ll gain a deep understanding of how to measure trade show success and effectiveness. This data-driven approach enables informed decision-making, validates marketing spend, and helps optimize future trade show participation for maximum ROI.
Remember to maintain consistent measurement across shows to establish benchmarks and track improvement over time. Regular analysis of these metrics will help refine your trade show strategy and demonstrate clear value to stakeholders. Most importantly, use the insights gained to continuously improve your trade show performance and achieve better results with each event.